Abstract
One of the most common mental illnesses that affects 5% of adults globally is depression. The advancement of social media has meant that more and more people have gained a platform to voice their thoughts and beliefs. People’s social media interactions and posted content can be used to infer critical characteristics such as depressive tendencies which will allow for timely intervention and help. This paper describes a novel supervised approach to detect depressive tendencies in Twitter users using multimodal frameworks which account for user interaction and online behaviour in addition to the tweet content processed using transformers like BERT. The performance of three multimodal frameworks is described with different methods for combining modalities. The best result is obtained with a cross-modality based model which improves the baseline by 12% points.
The problem
Most prior work on depression and social media tries to decide whether a user has depression, often starting from self-reported or clinically confirmed diagnoses. We look at a weaker but earlier signal: depressive tendencies. Following the distinction between a depressive state and a depressive disposition, a tendency is a probabilistic trait that raises the likelihood of experiencing the state. A single tweet cannot support a diagnosis, but it can show tendencies that serve as early warning signs.
Text-only models also ignore two things that prior studies say are distinctive for users with depression: how they use the platform (posting to express themselves rather than to interact) and how other users respond to their posts. We ask whether tweet features (likes, retweets, replies, hashtags, mentions) and user features (followers, following, tweet count) can supplement the tweet text when identifying depressive tendencies.
Approach
Data. We built a list of 98 search phrases by studying online depression communities such as r/Depression and mapping phrases to PHQ-9 symptoms, then used the Twitter API to collect up to 100 tweets per phrase between 20 May and 12 June 2022, along with tweet and user metadata. After cleaning, 5,997 English tweets remained. Two trained annotators, supervised by a psychology professor, labelled each tweet with a yes or no answer to the question “Does this tweet imply the user is displaying tendencies which may be associated with symptoms of depression?” using PHQ-9-based criteria. 488 tweets were labelled as showing depressive tendencies, and inter-annotator agreement was a Cohen’s kappa of 0.83. The dataset is anonymised and no tweets are quoted in the paper.
Features. Each example has three modalities: the tweet text, a vector of tweet attributes (retweet, reply, like and quote counts, creation time, hashtags, mentions) and a vector of user attributes (followers, following, tweet count, listed count).
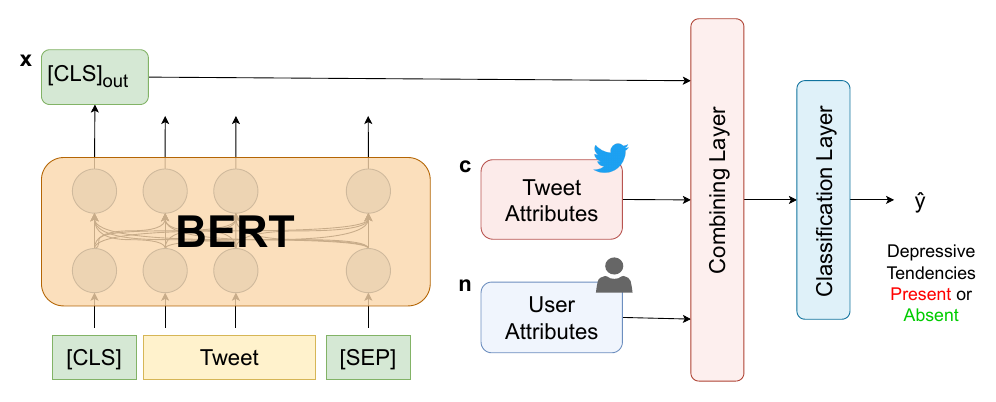
Three multimodal frameworks. The text is encoded by BERT (bert-base-uncased); its [CLS] output x is combined with the tweet vector c and the user vector n into a multimodal representation m, which a single fully connected layer with ReLU turns into the prediction. We compare three combining layers:
- Concatenation:
m = x || c || n. - MLP on tweet and user attributes:
m = x || MLP(c || n), so the tabular features are first passed through a multilayer perceptron. - Cross-modal attention: each modality is projected by a single-layer feed-forward network, and the tweet and user features are queried against the text feature to produce attention weights, giving m as an attention-weighted sum of the three projected modalities.
Each framework is trained with text plus tweet features, text plus user features, and text plus both, which acts as an ablation over the modalities. Models were trained for 2 epochs with Adam on an 8:1:1 stratified train/dev/test split.
Example
The dataset is anonymised, so the paper illustrates its annotation guideline with the kinds of tweet that the search phrases surface. The quotes below are the ones given in the paper’s annotation criteria.
Input (search phrase, collected tweet)
Output (annotation)
Input (annotation question)
Output (criteria for “present”)
Results
Test-set results for the text-only baseline and the three multimodal frameworks, each with different feature combinations:
| Model | Features | Accuracy | Precision | Recall | F1 |
|---|---|---|---|---|---|
| BERT (baseline) | text | 0.955 | 0.7872 | 0.6981 | 0.74 |
| BERT + concat | text + user | 0.9666 | 0.7857 | 0.8301 | 0.8073 |
| BERT + concat | text + tweet | 0.9616 | 0.7962 | 0.8113 | 0.8037 |
| BERT + concat | text + user + tweet | 0.9700 | 0.8214 | 0.8679 | 0.844 |
| BERT + MLP | text + user + tweet | 0.9666 | 0.8214 | 0.8679 | 0.844 |
| BERT + cross-modal attention | text + user | 0.9633 | 0.8000 | 0.301 | 0.8148 |
| BERT + cross-modal attention | text + tweet | 0.9716 | 0.9750 | 0.7358 | 0.8387 |
| BERT + cross-modal attention | text + user + tweet | 0.9766 | 0.9545 | 0.7924 | 0.8659 |
Source: Table 2 of the paper (8 of its 10 rows; the MLP framework's text + user and text + tweet rows score 0.8037 and 0.8387 F1). Values are as printed in the paper, including the 0.301 recall entry. Higher is better.
- The cross-modal attention model with all three modalities is the best system with an F1 of 0.8659 and accuracy of 0.9766, 12 points of F1 above the text-only baseline.
- Every framework gains from the extra modalities: concatenation and MLP with all three reach 0.844 F1, and even a single extra modality adds 6 to 10 F1 points over the baseline.
- In two of the three frameworks, text plus tweet features beats text plus user features, which suggests that how other users interact with a specific tweet is more informative than static user-level features.
- The paper also contributes the annotated dataset of 5,997 tweets, the 98 depression-related search phrases used to collect it, and a baseline for future work on detecting mental-health signals from social media activity.
Dataset built for the paper:
| Statistic | Value |
|---|---|
| Search phrases (mapped to PHQ-9 symptoms) | 98 |
| Collection window | 20 May to 12 June 2022 |
| Tweets after cleaning (English) | 5,997 |
| Labelled depressive tendency present | 488 |
| Annotators | 2, supervised by a psychology professor |
| Inter-annotator agreement (Cohen’s kappa) | 0.83 |
| Train / dev / test split | 8 : 1 : 1, stratified |
Source: Sections 4 and 6 of the paper.
Resources
- Paper on the ACM Digital Library (MLNLP 2022, DOI 10.1145/3578741.3578817)
- Related: Multimodal depression detection from Twitter data, follow-up work with the same team fusing tweet text with profile images
- Related: the same tweet-and-user feature idea applied to claim detection in my CheckThat! 2022 paper
- More of my work on the publications page