Abstract
Intimacy is an essential element of human relationships and language is a crucial means of conveying it. Textual intimacy analysis can reveal social norms in different contexts and serve as a benchmark for testing computational models’ ability to understand social information. In this paper, we propose a novel weak-labeling strategy for data augmentation in text regression tasks called WADER. WADER uses data augmentation to address the problems of data imbalance and data scarcity and provides a method for data augmentation in cross-lingual, zero-shot tasks. We benchmark the performance of State-of-the-Art pre-trained multilingual language models using WADER and analyze the use of sampling techniques to mitigate bias in data and optimally select augmentation candidates. Our results show that WADER outperforms the baseline model and provides a direction for mitigating data imbalance and scarcity in text regression tasks.
The problem
SemEval-2023 Task 9 (Multilingual Tweet Intimacy Analysis) asks systems to predict a continuous intimacy score from 1 to 5 for tweets. Training data (the MINT dataset, 9,491 tweets) covers six languages: English, Spanish, Italian, Portuguese, French, and Chinese. The test set adds four unseen languages: Hindi, Arabic, Dutch, and Korean. Evaluation is Pearson’s r.
Two problems make this hard. The labels are heavily skewed toward the low end of the scale: 75% of training tweets have an intimacy score of 2.667 or less, so high-intimacy examples are scarce. And the zero-shot languages have no training data at all. Text data augmentation is well studied for classification and NER, but we are not aware of prior work targeting text regression, where augmented examples need a continuous label rather than a class.
Approach
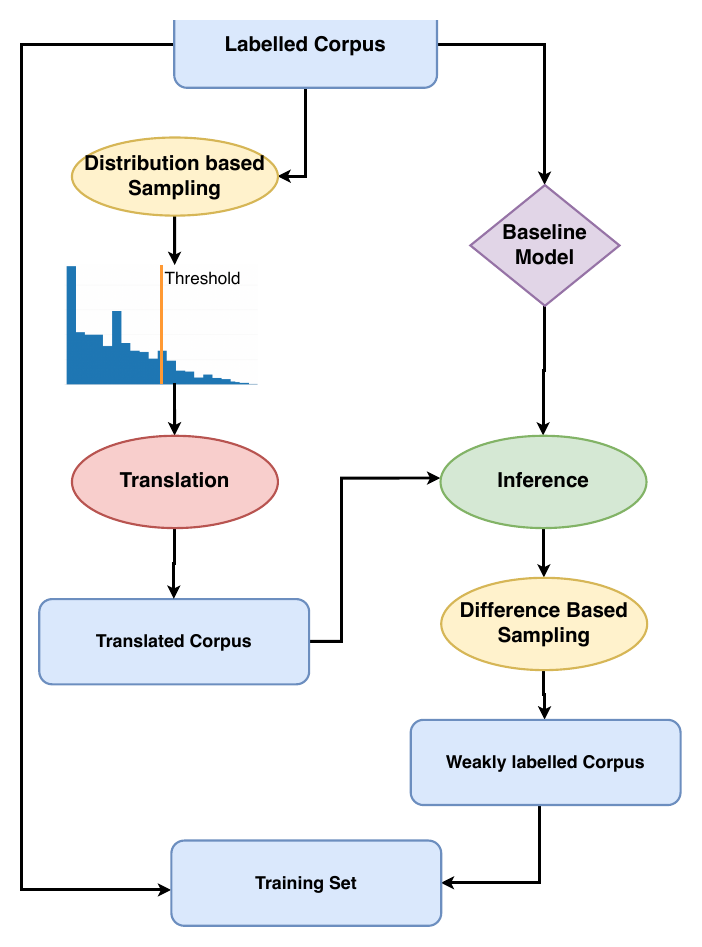
WADER is a weak-labelling pipeline that turns translation into a source of labelled regression data.
- Distribution-based sampling. Because not every label needs augmentation, we select candidate tweets above a label threshold p (3.2 in our runs), which targets the under-represented high-intimacy region.
- Translation. Each sampled tweet is translated with the Google Translate API. For an unseen language, sampled tweets from every training language are translated into it. For a seen language, tweets are translated into every other language and back-translated into the source. The translated pool contains 49,774 sentences.
- Label validation. A baseline model (XLM-RoBERTa or XLNet fine-tuned on gold data only) predicts an intimacy score for every translated sentence.
- Difference-based sampling. We keep translations whose predicted score is within a threshold beta of the label inherited from the source tweet, using beta = 0.1, 0.2, and 0.3 (5,102, 10,581, and 16,187 sentences respectively). The mean difference over the whole pool is 0.62, and 75% of sentences are within 0.86.
The retained weakly labelled sentences are added to the gold training set. We fine-tune xlm-roberta-base and xlnet-base-cased with a single linear head and a clamp to [1, 5], trained for 2 epochs with Adam, batch size 8, and learning rate 4e-5. Six ensembles of these models, combined by mean prediction, are also evaluated.
Results
All numbers are Pearson’s r on the official test set. “beta-Model” is the model fine-tuned on gold labels plus the WADER set filtered at difference threshold beta.
| System | Overall | Seen langs. | Unseen langs. | English | Italian | French | Korean | Arabic |
|---|---|---|---|---|---|---|---|---|
| Baseline XLM-RoBERTa | 0.52 | 0.65 | 0.35 | 0.60 | 0.64 | 0.60 | 0.37 | 0.42 |
| 0.1-XLM-RoBERTa | 0.52 | 0.66 | 0.34 | 0.61 | 0.67 | 0.63 | 0.35 | 0.48 |
| 0.2-XLM-RoBERTa | 0.52 | 0.67 | 0.33 | 0.63 | 0.67 | 0.64 | 0.38 | 0.49 |
| 0.3-XLM-RoBERTa | 0.53 | 0.66 | 0.35 | 0.63 | 0.67 | 0.64 | 0.43 | 0.50 |
| Baseline XLNet | 0.38 | 0.51 | 0.22 | 0.62 | 0.47 | 0.47 | -0.03 | 0.05 |
| 0.3-XLNet | 0.42 | 0.52 | 0.29 | 0.61 | 0.53 | 0.50 | 0.16 | 0.19 |
| Ensemble-1 | 0.53 | 0.67 | 0.34 | 0.63 | 0.68 | 0.64 | 0.40 | 0.49 |
| Ensemble-6 (final submission) | 0.53 | 0.65 | 0.37 | 0.64 | 0.64 | 0.61 | 0.36 | 0.48 |
Source: Table 5 of the paper. Pearson's r on the SemEval-2023 Task 9 test set; Spanish, Portuguese, Chinese, Hindi, and Dutch columns omitted. The final submission (Ensemble 6) ranked 32nd overall, 34th on seen languages, and 29th on unseen languages in the shared task. Higher is better.
- WADER improves on the transformer baselines in all categories except one, where it ties with an ensemble. With beta = 0.3, XLM-RoBERTa gains in English (0.60 to 0.63), Italian (0.64 to 0.67), French (0.60 to 0.64), Korean (0.37 to 0.43), and Arabic (0.42 to 0.50).
- XLNet benefits more in relative terms: 0.38 to 0.42 overall and 0.22 to 0.29 on unseen languages with beta = 0.3.
- Moderate beta values (0.2, 0.3) tend to beat the strictest filter (0.1): the larger, more diverse training sets act as a regulariser.
- XLM-RoBERTa consistently beats XLNet on multilingual data, which underlines the value of multilingual pre-training; XLNet only wins on English.
Training data and augmentation sets
| Language | Tweets | Mean intimacy | 75th percentile |
|---|---|---|---|
| English | 1,587 | 1.89 | 2.4 |
| Chinese | 1,596 | 2.27 | 2.8 |
| French | 1,588 | 2.06 | 2.6 |
| Italian | 1,532 | 1.94 | 2.425 |
| Spanish | 1,592 | 2.21 | 2.8 |
| Portuguese | 1,596 | 2.16 | 2.8 |
| Overall | 9,491 | 2.09 | 2.67 |
Source: Table 1 of the paper (MINT training set). Intimacy is scored on a 1-5 scale.
| Difference threshold beta | Weakly labelled sentences kept |
|---|---|
| 0.1 | 5,102 |
| 0.2 | 10,581 |
| 0.3 | 16,187 |
Source: Table 3 of the paper, out of 49,774 translated sentences. Over the whole pool the mean absolute difference between predicted and inherited label is 0.62, the median 0.47, and the 75th percentile 0.86 (Table 2).
Resources
- Paper: ACL Anthology · arXiv:2303.02758 · Hugging Face papers
- Code: github.com/Darthfire/wader (built on
simpletransformers,googletrans,pandas,scikit-learn) - Task: SemEval-2023 Task 9, Multilingual Tweet Intimacy Analysis (Pei et al., 2022)
- Related: Multimodal depression detection from Twitter data, another collaboration with the same advisors; The Geometry of Multilingual Language Models, on how XLM-R represents seen and unseen languages
- All publications