Abstract
Flowcharts are a critical tool for visualizing decision-making processes. However, their non-linear structure and complex visual-textual relationships make it challenging to interpret them using LLMs, as vision-language models frequently hallucinate nonexistent connections and decision paths when analyzing these diagrams. This leads to compromised reliability for automated flowchart processing in critical domains such as logistics, health, and engineering. We introduce the task of Fine-grained Flowchart Attribution, which traces specific components grounding a flowchart referring LLM response. Flowchart Attribution ensures the verifiability of LLM predictions and improves explainability by linking generated responses to the flowchart’s structure. We propose FlowPathAgent, a neurosymbolic agent that performs fine-grained post hoc attribution through graph-based reasoning. It first segments the flowchart, then converts it into a structured symbolic graph, and then employs an agentic approach to dynamically interact with the graph, to generate attribution paths. Additionally, we present FlowExplainBench, a novel benchmark for evaluating flowchart attributions across diverse styles, domains, and question types. Experimental results show that FlowPathAgent mitigates visual hallucinations in LLM answers over flowchart QA, outperforming strong baselines by 10-14% on our proposed FlowExplainBench dataset.
The problem
Flowcharts encode a process as a graph: nodes are steps or decisions, and edges carry the conditions that move you from one to the next. When a vision-language model answers a question about a flowchart, it has to read that structure off the pixels, and it often gets it wrong in a way that is hard to catch. The answer reads fluently but follows an edge that does not exist, or skips a decision node that was actually on the path.
Attribution is the standard fix for text: point to the evidence. For flowcharts there was no equivalent. We define fine-grained flowchart attribution as mapping a flowchart-referring statement (here, a question-answer pair) to the set of regions in the image that ground it. The attributed path should be the shortest one that supports the statement, should match the flow of the process it describes, and should not need any regions outside itself to explain the statement.

Approach
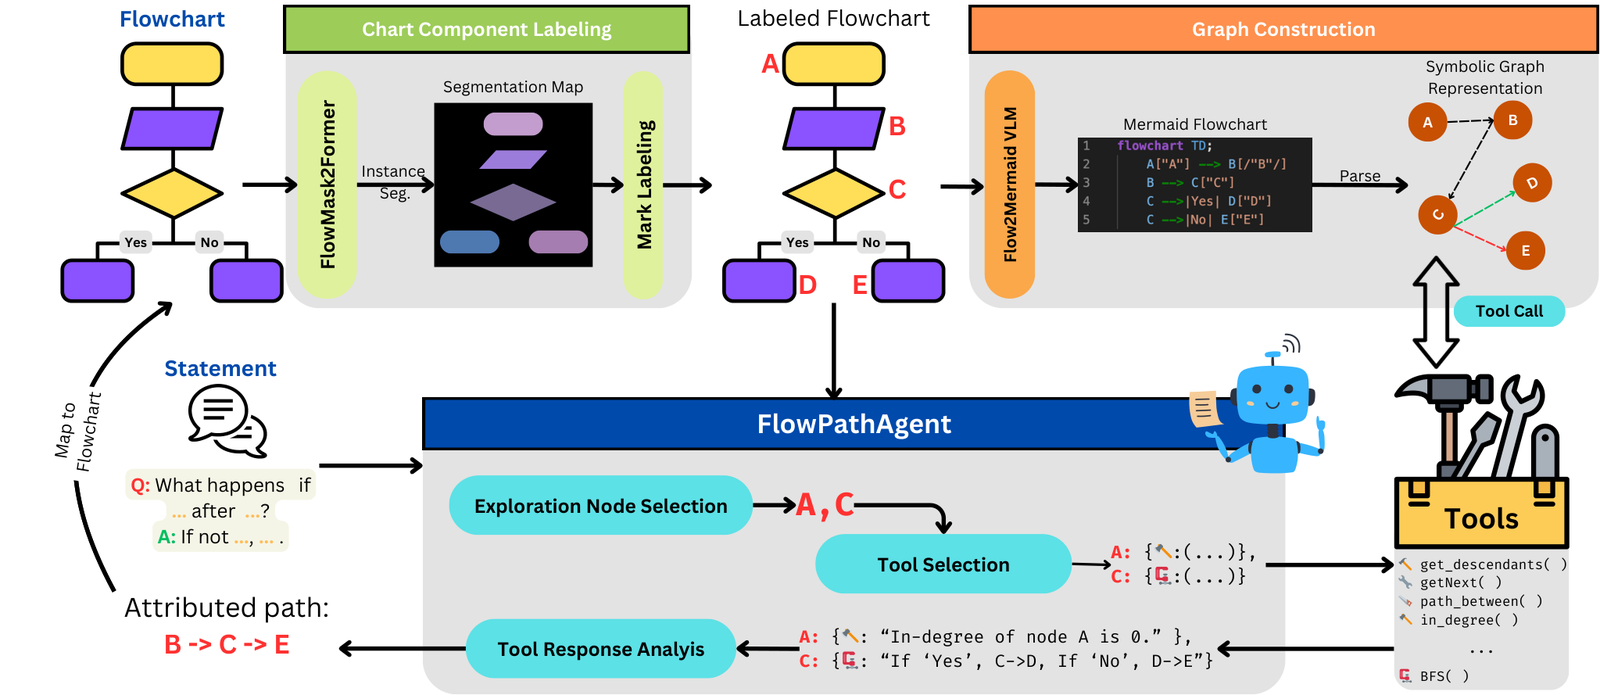
FlowPathAgent is a neurosymbolic agent with three stages.
- Chart Component Labeling. We fine-tune Mask2Former on a synthetic, style-diversified split built from FlowVQA training data to get FlowMask2Former, an instance segmentation model for flowchart nodes. Each segmented node is labeled with an alphabetical identifier rendered in red on the image, so that the visual and symbolic representations share anchors.
- Graph Construction. Flow2Mermaid VLM, a Qwen2-VL (7B) model fine-tuned with SFT, transcribes the labeled flowchart into Mermaid code using the node labels as anchors. The Mermaid code is parsed into a symbolic graph that keeps boolean conditional edges and node-level statements, and we expose a suite of graph tools over it (for example
get_descendants,getNext,path_between,in_degree,BFS). - Neurosymbolic Agent. The agent plans over the labeled image once (node selection), then loops through tool selection and tool execution on the symbolic graph, analyzes the tool responses against the input statement, and emits a path of node labels. The path is mapped back onto the original flowchart through the segmentation regions.
Treating the flowchart as a graph rather than a picture means distant relationships and edge conditions are handled by exact operations instead of visual guesswork, which is where purely visual models compound errors on large charts.
FlowExplainBench is built from the FlowVQA test split (Code, Wiki, and Instruct domains) and covers four question types: Fact Retrieval, Applied Scenario, Flow Referential, and Topological. We render every chart in four visual styles (single color, multi color, default Mermaid, black and white). Attributions were first labeled by GPT-4 on the Mermaid source and then verified by two human annotators, with trivial count questions filtered out. The final benchmark has 1,238 QA pairs over 953 flowcharts, with an average of 21 nodes per chart and attributed paths of up to 35 nodes.
Example
The paper’s opening example (Figure 1, shown above under “The problem”) asks a question about a vehicle-breakdown preparedness flowchart and contrasts two LLM answers. Attribution is what separates them: the path behind the hallucinated answer runs against the chart, the path behind the correct answer follows it.
Flowchart question
Hallucinated response
Attributed path: Notify Trusted Contact of Travel Plans → Need to Leave Vehicle? → Utilize Prepared Items for Seeking Help. The path is not logically consistent with the chart, which offers the opportunity to eliminate this response.
Correct response
Attributed path: Need to Leave Vehicle? → (Yes) Utilize Prepared Items for Seeking Help → Readiness for Potential Vehicle Breakdown. The path is logically consistent; the attribution validates and visually grounds the answer.
The second example is the paper’s qualitative comparison (Figure 5). It shows the full agent trace on an Applied Scenario question and contrasts it with the strongest baseline, GPT-4o with Set-of-Marks prompting over the same FlowMask2Former segments.

Statement (question + answer)
Answer: Sophia should continue without altitude adjustment unless the specific context of her work requires it.
GPT-4o + FlowMask2Former Set of Marks
Attributed path: B → C → F → G → J → M → N (over-attributes: includes steps before and after the ones the statement depends on).
FlowPathAgent
Tool calls:
get_ancestors("C", include_statements=True) → ancestors of node C: B (Input the number of yards ('yd')), A (Start). get_descendants("C", include_statements=True) → descendants of node C: N (End), M (Obtain the converted value in meters ('m')), L, H, F (Use the online calculator), G (Is altitude adjustment needed?), I, J (Continue without altitude adjustment), K, D, E.Attribution: C → F → G → J. "The nodes C and F are relevant as they involve the use of an online calculator, which Sophia opted for. Node G is crucial because it questions the need for altitude adjustment, directly relating to the question. Node J supports the answer by advising to continue without altitude adjustment, aligning with the given response."
Results
| Method | Overall P | Overall R | Overall F1 | Code F1 | Wiki F1 | Instruct F1 |
|---|---|---|---|---|---|---|
| Kosmos-2 | 37.14 | 1.76 | 3.36 | 11.16 | 0.60 | 3.14 |
| LISA | 18.01 | 14.34 | 15.97 | 24.87 | 12.81 | 17.24 |
| SA2VA | 66.36 | 9.88 | 17.20 | 31.10 | 13.14 | 15.56 |
| VisProg | 45.95 | 0.46 | 0.91 | 4.49 | 0.00 | 0.18 |
| GPT-4o zero-shot bounding box | 58.82 | 1.90 | 3.68 | 3.69 | 2.51 | 5.70 |
| GPT-4o + FlowMask2Former SoM | 74.10 | 67.69 | 70.75 | 68.77 | 69.47 | 74.22 |
| FlowPathAgent | 77.19 | 77.21 | 77.20 | 77.27 | 75.23 | 80.23 |
Source: Table 2 of the paper. Micro-averaged precision, recall, and F1 (%) over attributed nodes on FlowExplainBench, with predicted regions matched to ground-truth nodes at IoU 0.7. Higher is better.
- FlowPathAgent is the best method on every split and beats the baselines by 6-65 percentage points overall; the 10-14% figure in the abstract is the gain over the strongest visual-grounding and agentic baselines.
- The visual grounding models (Kosmos-2, LISA, SA2VA) and zero-shot bounding boxes have very low recall: they can segment a node but cannot follow the chart’s logic. GPT-4o with Set-of-Marks does far better because FlowMask2Former puts the right candidate nodes in front of it, but it tends to over-attribute steps further along the chart.
- Performance drops for every method as the number of nodes grows, but FlowPathAgent has the smallest drop along the long tail of node counts (Figure 3), because it treats nodes as logical entities rather than pixels.
- Error propagation across the pipeline is limited: FlowMask2Former reaches Jaccard similarity (IoU > 0.5) of 0.98 on the full benchmark, Flow2Mermaid VLM reaches word F1 of 0.89, and task F1 stays between 82.7 and 86.7 for all segmentation-quality bins above 63% IoU (Table 3).
FlowExplainBench statistics
| Code | Wiki | Instruct | Overall | |
|---|---|---|---|---|
| Flowcharts | 189 | 470 | 294 | 953 |
| Questions | 246 | 610 | 382 | 1,238 |
| Fact Retrieval | 88 | 163 | 102 | 353 |
| Applied Scenario | 69 | 128 | 90 | 287 |
| Flow Referential | 43 | 128 | 87 | 258 |
| Topological | 46 | 191 | 103 | 340 |
| Avg. / max nodes per chart | 11.85 / 29 | 24.49 / 43 | 21.59 / 44 | 21.08 / 44 |
| Avg. / max attributed path length | 2.59 / 15 | 3.21 / 35 | 2.88 / 21 | 2.99 / 35 |
Source: Table 1 of the paper. Every chart is rendered in one of four visual styles (single color, multi color, default Mermaid, black and white); annotations were produced by GPT-4 on the Mermaid source and verified by two human annotators (Cohen's kappa 0.89 between annotators).
Resources
- Paper on arXiv and the ACL Anthology page
- Code and FlowExplainBench on GitHub (
data/dataset.jsonholds the QA pairs and ground-truth attributions) - Checkpoints on Hugging Face: Flow2Mermaid VLM and FlowMask2Former; training data for Flowchart2Mermaid and flowchart segmentation
- Hugging Face Papers page
- Adobe Research publication page
- Related: ChartLens, our earlier work on fine-grained visual attribution in charts, and all publications
Quick start
From the repository README: the three pipeline stages run in order, then the agent is called on the benchmark.
git clone https://github.com/MananSuri27/FollowTheFlow.git
cd FollowTheFlow
pip install -r requirements.txt
python pipeline/seg_inference_scale.py   # 1. Chart Component Labeling
python pipeline/flowchart2mermaid.py     # 2. Graph Construction
from pipeline.agents.chartpathagent import FlowPathAgent, main

input_dir = "./data/images"
input_json = "./data/dataset.json"
output_dir = "./output/chartpathagent_run"

agent = FlowPathAgent()
main(input_dir, input_json, output_dir, agent)